When you first log into SignalFinder Pro, you might be wondering where to start. There is a lot here, and that is a good thing. This guide will not walk you through every feature (that is what the rest of the blog is for), but it will give you a clear picture of what each section does so you can hit the ground running.
SignalFinder Pro is organized into nine main sections, each accessible from the sidebar. Let's walk through them one by one.
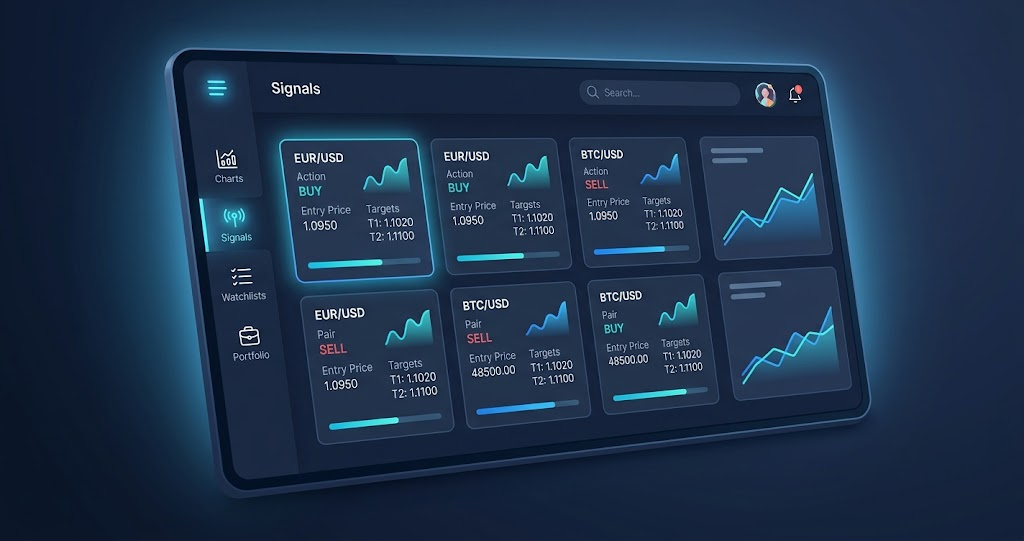
1. Signal Dashboard
Your home base. The Signal Dashboard is the first thing you see when you log in. It shows all active signals across every strategy in one place.
At the top you will find four summary cards:
- New — signals detected today
- Active — signals currently in play with unreached targets
- Triggered — signals where at least one target has been hit
- Expired — signals that have aged out without activation
Each signal card shows the ticker, direction (bullish or bearish), entry price, stop loss, target levels, and the reward-to-risk ratio. Click any signal to open the full chart view with Fibonacci projections and ABC structure overlaid.
The badge number next to Signal Dashboard in the sidebar tells you how many total signals are available right now.
Beginner Tip
Start by sorting signals by reward-to-risk ratio. This surfaces the setups where the potential gain is largest relative to the risk. It is the fastest way to find high-quality trades without analyzing every signal manually.
2. Market Drill-Down
Filter signals by sector, industry, and market cap. The Market Drill-Down page lets you narrow the signal universe based on where a stock sits in the market.
If you focus on a particular sector like Technology or Healthcare, this is where you go. Select a sector to see all industries within it, then drill into specific industries to see only the signals that match.
You can also filter by market cap (large, mid, small) to match your risk tolerance and trading style. Large-cap stocks tend to move slower but more predictably. Small-cap stocks can be more volatile but offer bigger percentage moves.
Beginner Tip
If you are new to trading, start with large-cap stocks in sectors you understand. Familiarity with the companies behind the signals helps you make better decisions and build confidence.
3. Best of Best
The highest-conviction signals of the day. Best of Best is a curated view that surfaces the top-ranked signals based on multiple quality factors.
Instead of scanning through hundreds of signals, Best of Best does the filtering for you. It ranks signals by a combination of technical strength, setup quality, and risk/reward profile. The result is a short list of the strongest setups available right now.
This is a great starting point for beginners because it cuts through the noise. If you only have time to look at a handful of setups each day, start here.
Beginner Tip
Use Best of Best as your daily starting point. Review the top signals each morning, pick one or two that interest you, and study the chart structure before deciding whether to trade.
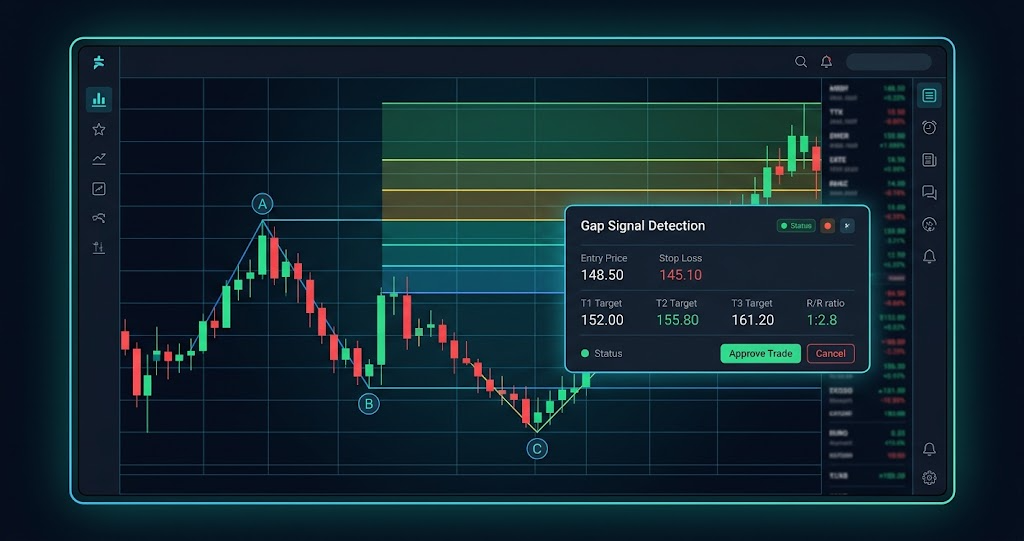
4. Gap Signals
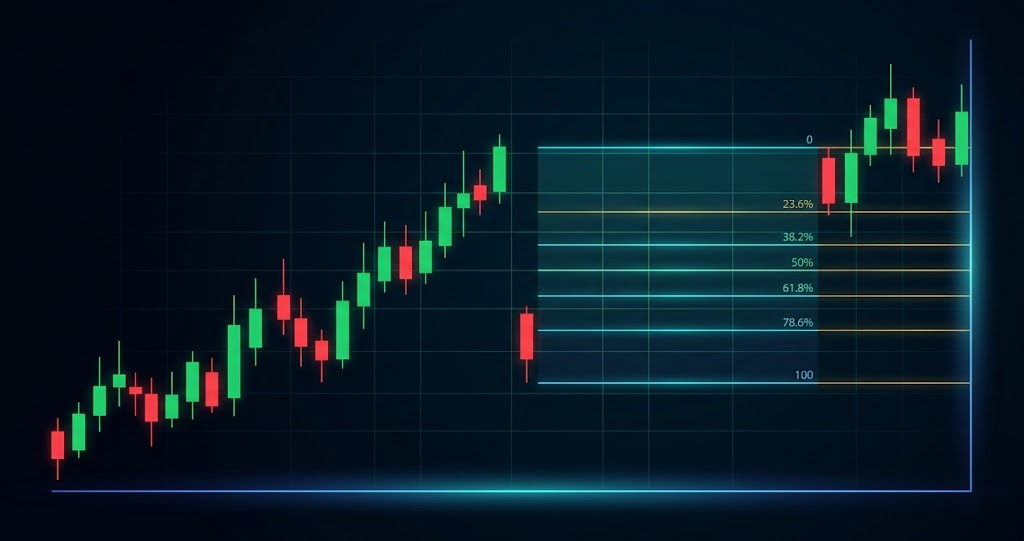
Overnight price jumps structured into tradeable setups. A gap happens when a stock opens at a price significantly higher or lower than where it closed the day before. This creates a visible price jump on the chart.
Gaps are caused by overnight news, earnings reports, analyst upgrades, or institutional buying. The Gap Signals page shows every detected gap with an ABC projection framework applied. This means each gap has a defined entry point (C-point), Fibonacci extension targets, a stop loss level, and a reward-to-risk ratio.
You can filter by direction (UP or DOWN) and sort by gap percentage to find the largest moves.
Beginner Tip
Do not chase the gap at market open. Wait for the ABC structure to form. The C-point pullback gives you a much better entry than buying in the first few minutes of trading.
Learn more: What is a Gap Signal? and How to Detect a Gap Signal Using SignalFinder Pro
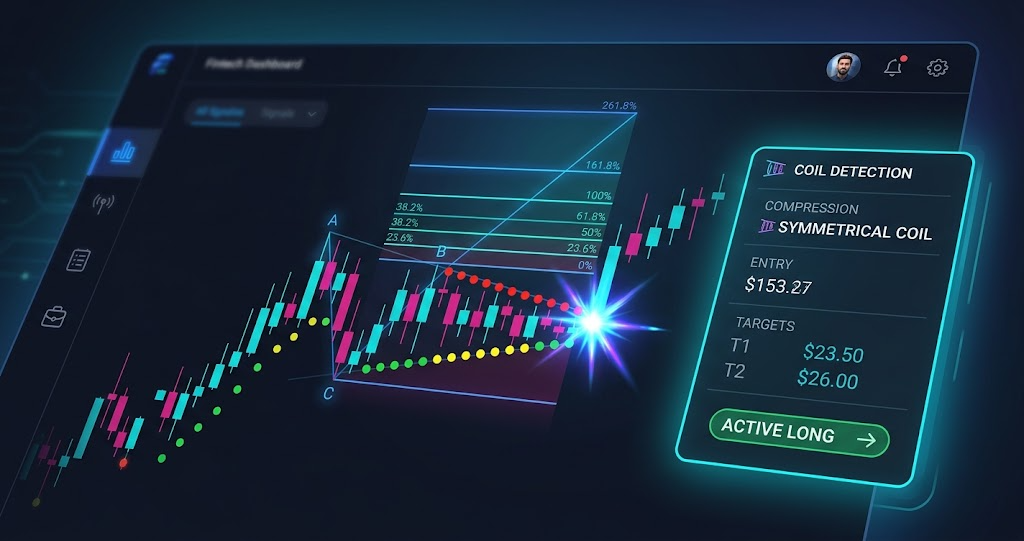
5. Coil Signals
Price compression that precedes explosive breakouts. A Coil setup occurs when a stock's price range gets tighter and tighter over time, like a spring being wound. When the compression finally releases, the resulting move is often large and directional.
The Coil Signals page shows stocks where the algorithm has detected this compression pattern. Each signal includes a compression intensity level (LOW, MID, or HIGH), an ABC projection with Fibonacci targets, and a status showing whether the coil has released yet.
HIGH compression coils represent the tightest springs with the most potential energy behind them. These tend to produce the most explosive breakouts.
Beginner Tip
Filter for HIGH compression coils that have not yet released. Add them to your watchlist and monitor daily. When the release happens with strong volume, the move can be significant.
Learn more: What is a Coil Setup? and How to Detect a Coil Setup Using SignalFinder Pro
6. Multi-Chart View
Compare multiple tickers side by side. Multi-Chart View lets you load several stock charts into a single screen so you can analyze them simultaneously.
This is useful when you have multiple signal candidates and want to compare their chart structures before deciding which one to trade. Instead of flipping between individual charts, you see them all at once.
You can load tickers from your watchlist, from the signal pages, or by searching directly. Each chart includes the same Fibonacci levels and ABC projections as the individual signal views.
Beginner Tip
After picking your top two or three candidates from Best of Best or Gap Signals, load them into Multi-Chart View. Comparing setups side by side makes it easier to spot the cleanest structure.
7. Blog
Education, strategy breakdowns, and platform updates. You are already here, which is a great start. The Blog section is organized by Popular Topics: Education, Strategies, Markets, and Bitcoin.
Education posts (like this one) explain how signals work, how to use the platform, and how to think about risk and structure. Strategy posts dive deeper into specific trading approaches. Markets and Bitcoin sections cover analysis and trends.
Use the blog alongside the signal pages to build your knowledge. Understanding why a signal works makes you a better trader than just following the entry and exit.
8. Watchlists
Save and monitor signals you are interested in. Watchlists let you bookmark signals from any page in SignalFinder Pro so you can track them over time without committing to a trade.
From any signal card or chart view, click the star icon to add it to a watchlist. You can create multiple watchlists to organize by strategy, sector, or timeframe.
The badge number next to Watchlists in the sidebar shows how many watchlists you have active.
Beginner Tip
Keep your watchlists focused. Five to ten carefully chosen signals are better than fifty random ones. Review your watchlist each morning to see how your candidates are progressing before looking for new setups.
Pro Feature
Watchlists are available to Pro and Premium subscribers. Upgrade from the Settings page to unlock this feature.
9. Portfolio
Track your trades and review your performance. The Portfolio section is where you log trades, record your entries and exits, and analyze how your trading is performing over time.
Tracking trades is one of the most underrated habits in trading. It helps you identify what is working, what is not, and where you can improve. Log each trade with the entry price, exit price, stop level, and the signal that triggered it.
Over time, your portfolio becomes a personal performance record that reveals your strengths and weaknesses as a trader.
Beginner Tip
Start logging every trade from day one, even if it feels tedious. After a month, review your portfolio to see which signal types and setups produced the best results for you personally.
What's Next
This is just the surface. Each section of SignalFinder Pro has more depth than this article can cover, and that is exactly what the rest of our Education series is here for. Pick one section that caught your attention and start there.
Suggested reads:
- What is a Gap Signal? — understand how overnight price gaps create structured trades
- What is a Coil Setup? — learn why price compression leads to explosive breakouts
- How to Detect a Gap Signal Using SignalFinder Pro — step-by-step walkthrough of the Gap Signals page
- How to Detect a Coil Setup Using SignalFinder Pro — step-by-step walkthrough of the Coil Signals page
Ready to explore? Go to Signal Dashboard →