From Concept to Detection
In the previous post, What is a Gap Signal?, we covered what gaps are, how the ABC projection framework structures them, and why they produce tradeable setups. Now let's see how SignalFinder Pro finds them for you automatically.
Instead of scanning pre-market movers and manually charting ABC projections, SignalFinder Pro runs the detection across the entire market and presents you with structured signals. Here is exactly how to use it.
Step 1: Navigate to Gap Signals
From the SignalFinder Pro sidebar, click Gap Signals. This is where all detected gap setups are listed. The page shows a table of active signals, each representing a stock where the algorithm has identified a gap with a valid ABC projection structure.
You will see columns for the ticker symbol, direction (UP or DOWN), gap percentage, activation status, and key Fibonacci levels.
Step 2: How SignalFinder Pro Detects Gap Signals
The algorithm monitors the market daily and applies a multi-step detection process:
Gap identification. It scans for stocks that opened with a significant percentage gap from the previous close. The gap percentage tells you the magnitude of the overnight move.
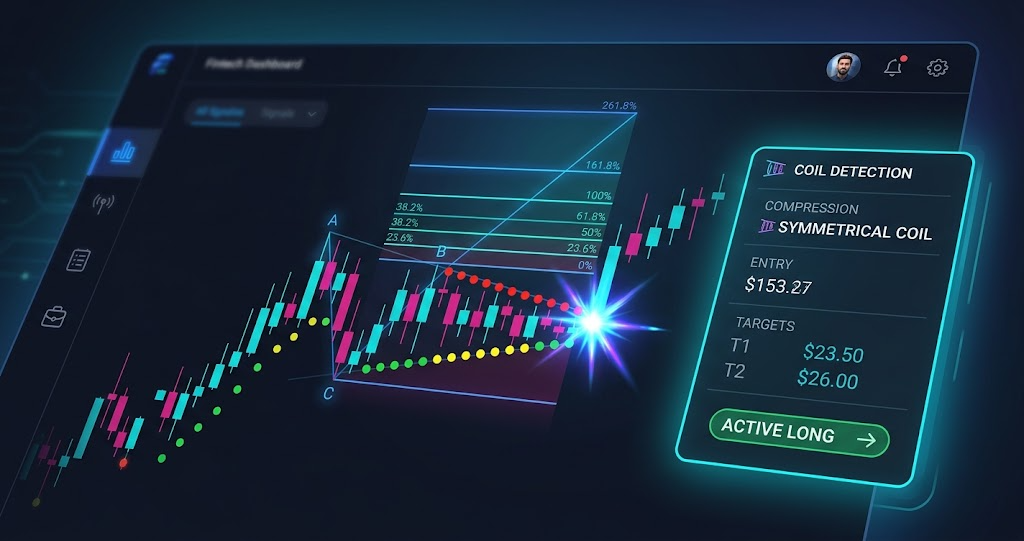
ABC projection. For each qualifying gap, the algorithm identifies three structural price points:
- A Point: The pre-gap price level
- B Point: The initial gap reaction peak or trough
- C Point: The pullback entry zone
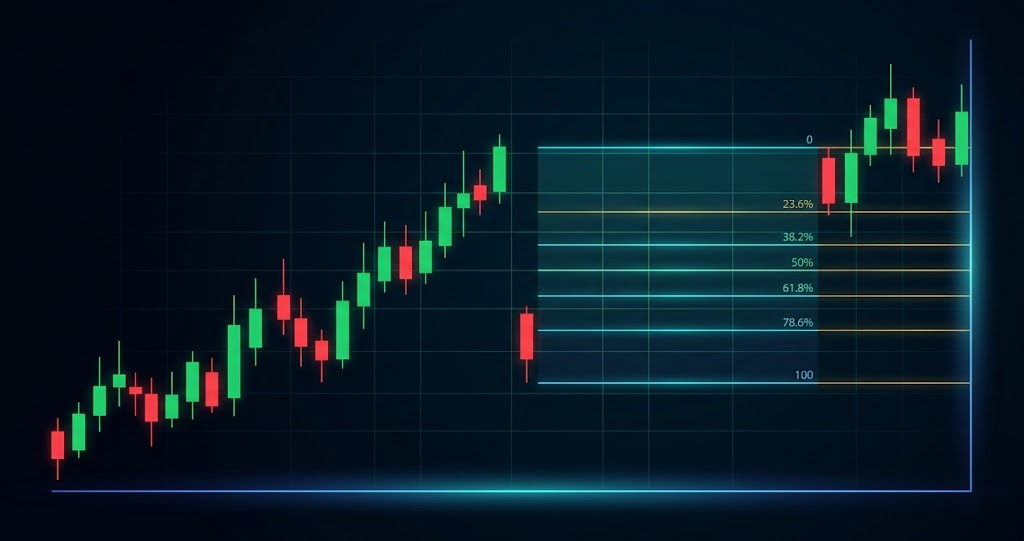
Fibonacci targets. From the ABC structure, eight Fibonacci extension levels are calculated:
- 0.382, 0.5, and 0.618 retracements
- 1.0 (full measured move)
- 1.618, 2.618, and 4.236 extensions
Activation tracking. The signal tracks whether price has activated (reached the first Fibonacci level) and marks each subsequent target as reached. This gives you a real-time view of how the trade is progressing.
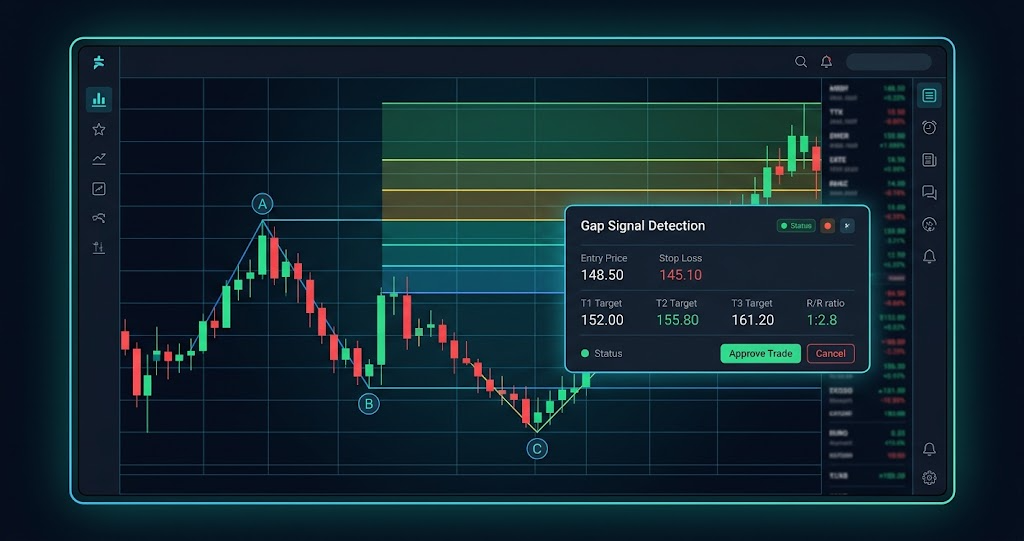
Step 3: Reading a Gap Signal Card
Click on any signal to open the chart view. Here is what you will see:
Entry price. The C-point of the ABC projection. This is the structured entry level where the pullback has created a defined risk/reward opportunity.
Fibonacci targets. All eight price levels are plotted as horizontal lines on the chart. Each level represents a potential take-profit zone, with the full 1.0 move being the primary target.
Stop loss. Derived from the C-point candle extremes. For a bullish gap, the stop sits just below the C-point candle low. For a bearish gap, it sits above the C-point candle high. This gives you a signal-specific risk level.
R/R ratio. The reward-to-risk ratio based on the next unreached Fibonacci target relative to your stop. As targets are reached, the R/R updates to reflect the current opportunity.
Status badge. Shows the signal lifecycle: Not Activated, Activated, Goal 1 Reached, Goal 2 Reached, or Extended Target.
Gap metadata. The gap percentage and dollar amount are displayed, along with the A, B, and C point prices and the number of days since the gap occurred.
Step 4: Filtering Gap Signals
Use the filters and search at the top of the Gap Signals page to narrow down setups:
- Direction: Filter for UP (bullish gaps) or DOWN (bearish gaps) based on your market bias
- Status: Focus on activated signals for confirmed momentum, or not-activated for early setups
- Search: Type a ticker symbol to check if a specific stock has an active gap signal
- Sort: Order by gap percentage to find the largest moves, or by date for the freshest signals
Step 5: Saving Gap Candidates to a Watchlist
Found a gap signal you want to monitor but are not ready to trade? Click the Watchlist button (star icon) in the chart header. Select an existing watchlist or create a new one.
This is especially useful for gap signals that have not yet activated. Save them to a watchlist and check back to see if price pulls back to the C-point entry zone.
Pro Feature
Watchlists are available to Pro and Premium subscribers. Upgrade from the Settings page to unlock this feature.
Step 6: Confirming the Setup on the Chart
Always verify the gap structure visually before acting. The built-in chart view shows:
- The candlestick chart with the gap clearly visible as a price jump
- All eight Fibonacci levels as horizontal price lines with distinct colors
- ABC projection markers labeling the structural points
- Goal breach indicators showing which targets have been reached
The Fibonacci legend in the bottom-left corner gives you an at-a-glance view of reached levels (highlighted), the next target (pulsing), and remaining levels.
For a broader perspective, use Multi-Chart View from the sidebar to compare multiple gap setups side by side. This helps you pick the cleanest structure when you have several candidates.
Putting It All Together
Here is the daily workflow for gap trading with SignalFinder Pro:
- Open Gap Signals to see all active gap setups
- Filter by direction and sort by gap percentage for the strongest moves
- Click a signal to open the chart view with ABC projection, targets, and R/R
- Evaluate the structure: Is the gap size significant? Is the C-point entry zone well-defined?
- Add promising setups to a Watchlist for monitoring
- Confirm visually on the chart before entering
- Track progress as Fibonacci targets are reached
New gap signals appear daily as the market opens. Check the page each morning to catch fresh setups.
Try It Now
Head to Gap Signals in SignalFinder Pro and see what gapped today. Start by sorting by gap percentage to find the largest moves, then check the ABC structure on the chart view.