Why Gaps Are One of the Most Actionable Setups
Every morning the market opens, dozens of stocks gap up or gap down from the previous day's close. These gaps represent overnight shifts in supply and demand driven by earnings, news, analyst upgrades, or institutional repositioning. For traders who understand the structure behind gaps, they represent some of the highest-probability setups available.
The challenge is that most traders react to gaps emotionally. They chase the move, enter without a plan, and get stopped out when the gap fills. A structured approach to gap trading changes that entirely.
What is a Gap?
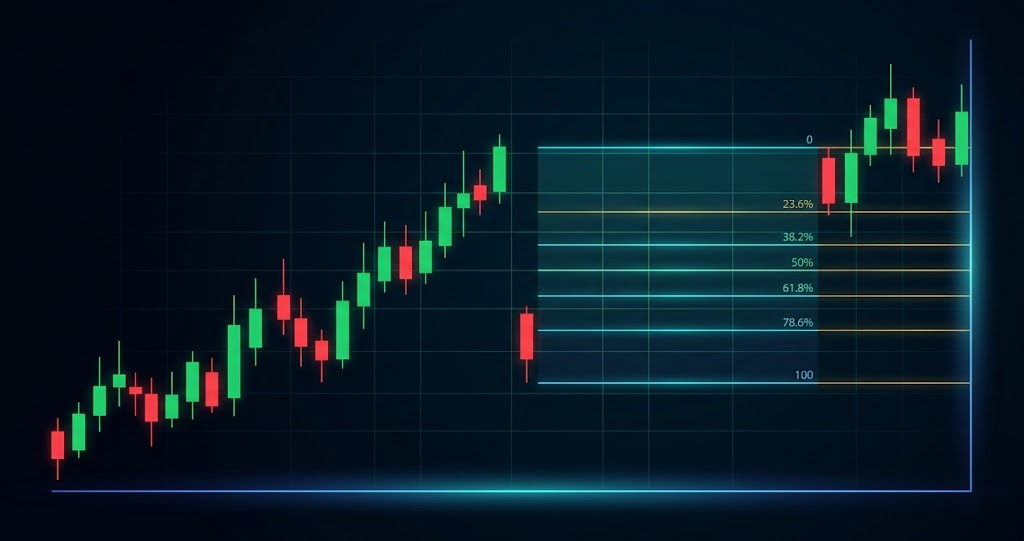
A gap occurs when a stock opens at a price significantly higher or lower than its previous close. On a candlestick chart, this shows up as empty space between the two candles where no trading occurred.
Gap Up: The stock opens above the previous day's high. This signals strong overnight buying pressure, often driven by positive news or earnings.
Gap Down: The stock opens below the previous day's low. This signals selling pressure, often from negative news, downgrades, or broader market weakness.
Types of Gaps
Not all gaps are created equal. Understanding the type helps you gauge the probability of follow-through:
Breakaway gaps occur at the start of a new trend, often after a long consolidation. These tend to have high volume and rarely fill. They signal a significant shift in sentiment.
Continuation gaps (runaway gaps) occur in the middle of an existing trend. They confirm that momentum is accelerating and the trend has legs.
Exhaustion gaps occur near the end of a trend. They look powerful initially but reverse quickly as the last buyers or sellers pile in. Volume may spike but follow-through fades.
Common gaps occur during normal trading ranges with no significant catalyst. These fill most frequently and are the least actionable.
How Gap Signals Use ABC Projection
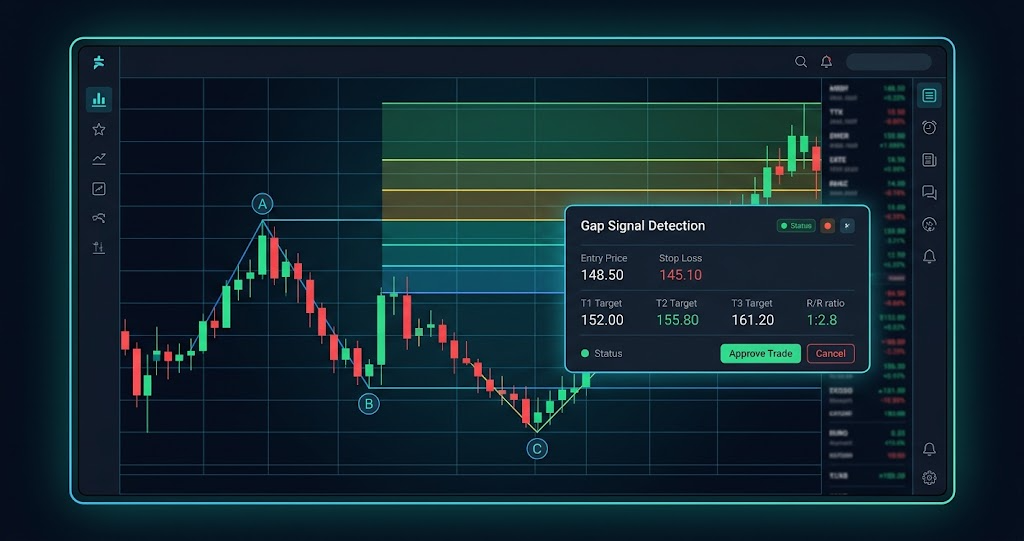
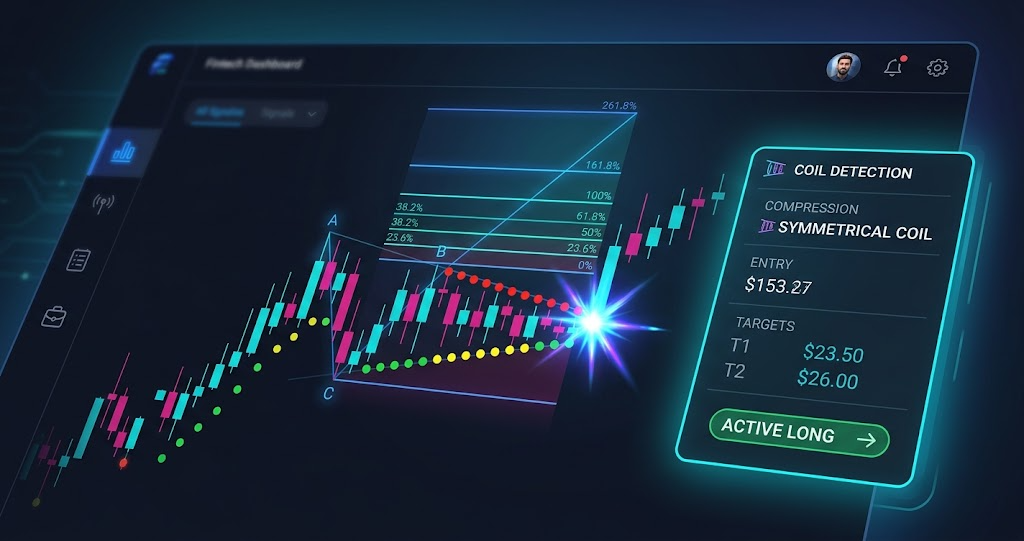
Raw gaps are just price movement. What makes a gap tradeable is structure. SignalFinder Pro applies an ABC projection framework to every detected gap:
A Point: The pre-gap price level. This establishes where the stock was before the catalyst.
B Point: The peak or trough after the initial gap move. This represents the maximum extension of the gap reaction.
C Point: The pullback level after the initial move. This is where the market digests the gap and establishes a potential entry zone.
From these three points, Fibonacci extension levels project where price is likely to travel next. The 0.382, 0.618, 1.0, and 1.618 levels become your targets. The C-point candle extreme becomes your stop loss.
This framework transforms a raw gap from "the stock went up a lot" into a structured trade with defined entry, targets, stop, and risk/reward ratio.
Why Gap Signals Work
Institutional activity drives gaps. Large overnight orders from institutions create gaps that often have follow-through because the buying or selling pressure continues into the regular session.
Supply and demand imbalance. A gap represents a sudden shift in the balance between buyers and sellers. Until the market absorbs this imbalance, price tends to continue in the gap direction.
Overnight catalysts create conviction. Gaps caused by earnings beats, FDA approvals, or major contracts reflect real fundamental changes. The market is repricing the stock, and the new price level often holds.
Gap Fill vs. Gap-and-Go
There are two primary strategies for trading gaps:
Gap Fill: Trading the expectation that the gap will close. Common gaps and exhaustion gaps frequently fill. The strategy involves waiting for the initial gap move to stall and then trading back toward the previous close. This is a mean-reversion approach.
Gap-and-Go: Trading in the direction of the gap, expecting follow-through. Breakaway and continuation gaps are candidates. The strategy involves waiting for a pullback to the C-point zone and entering in the gap direction with Fibonacci targets above. This is a momentum approach.
SignalFinder Pro's ABC projection framework is designed around the Gap-and-Go approach, giving you structured entries and targets for gaps that are likely to continue.
Common Mistakes to Avoid
Chasing the open. The worst time to enter a gap trade is in the first few minutes. Wait for the ABC structure to form. The C-point pullback gives you a much better entry than buying at the open.
Ignoring gap size. A 0.5% gap and a 5% gap are completely different setups. Larger gaps signal stronger catalysts and have different fill probabilities. Filter for gaps that meet your minimum threshold.
Trading without a stop. Every gap trade needs a defined stop loss. The C-point candle extreme provides a natural stop level that aligns with the structure of the setup.
Ignoring the broader market. A bullish gap in a stock means less if the entire market is gapping down. Always check the market context before committing to a gap trade.
What's Next
Now that you understand what gap signals are and how the ABC projection framework structures them into tradeable setups, the next step is learning how to find them automatically.
Read the next post: How to Detect a Gap Signal Using SignalFinder Pro for a step-by-step walkthrough of the Gap Signals page.