From Concept to Detection
In the previous post, What is a Coil Setup?, we covered the theory behind Coil setups: how price compression builds energy that gets released as explosive breakouts. Now let's put that knowledge to work.
Instead of manually scanning hundreds of charts looking for compression patterns, SignalFinder Pro does the detection for you. Here is exactly how to use it.
Step 1: Navigate to Coil Signals
From the SignalFinder Pro sidebar, click Coil Signals. This is where all detected Coil setups are listed. The page shows a table of active signals, each representing a stock where the algorithm has identified a compression pattern.
You will see columns for the ticker symbol, direction (UP or DOWN), compression type (LOW, MID, or HIGH), activation status, and key price levels.
Step 2: How SignalFinder Pro Detects Coil Setups
Behind the scenes, the algorithm monitors every stock in the universe for three conditions:
Volatility compression. It checks whether volatility bands have contracted to extreme levels. The compression type (LOW, MID, HIGH) tells you the degree of coiling:
- LOW compression is the first level of coiling. Volatility has started to contract but still has room to tighten.
- MID compression means the bands have compressed further. The coil is getting tighter.
- HIGH compression means maximum contraction. The tightest coil with the highest potential energy behind the eventual move.
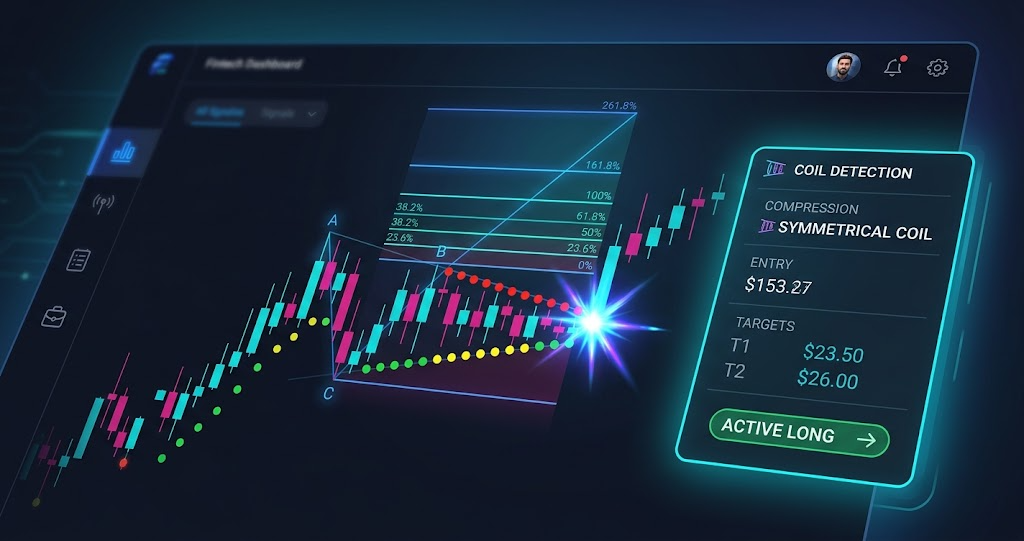
ABC projection. SignalFinder Pro identifies three key price points (A, B, and C) that define the structure of the setup. These points establish the range used to calculate Fibonacci extension targets for the breakout.
Momentum confirmation. Once the coil releases (compression ends), SignalFinder Pro checks the momentum direction to confirm the breakout and marks the signal as activated.
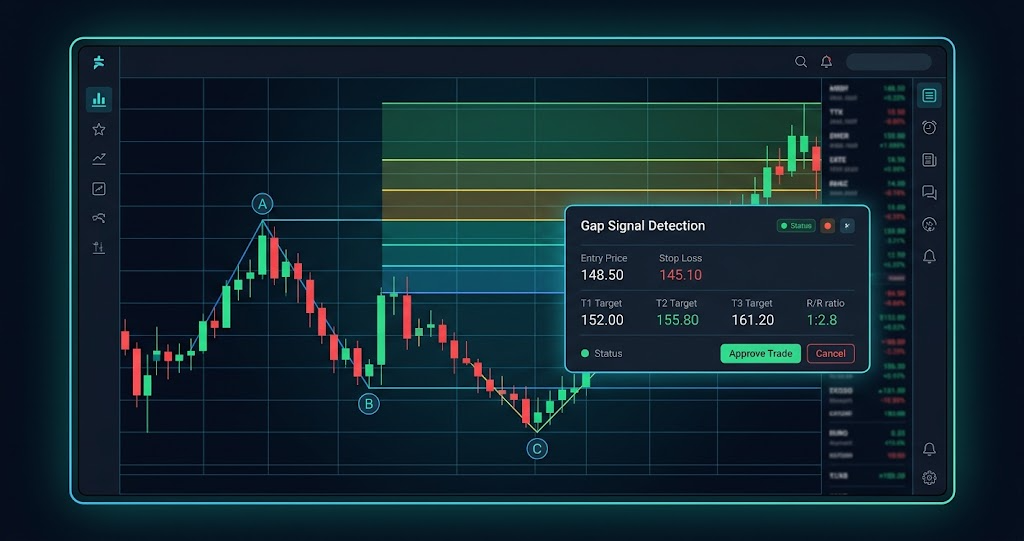
Step 3: Reading a Coil Signal Card
Click on any signal to open the chart view. Here is what you will see:
Entry price. The C-point of the ABC projection. This is where the setup suggests entering the trade.
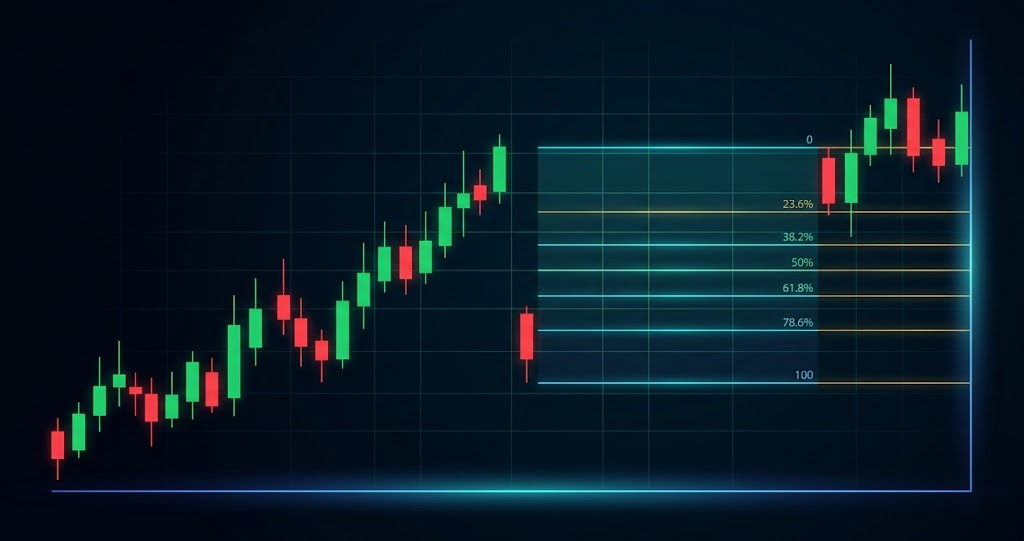
Fibonacci targets. Eight price levels calculated from the ABC range:
- 0.382, 0.5, and 0.618 retracements
- 1.0 (full measured move)
- 1.618, 2.618, and 4.236 extensions
Stop loss. Derived from the C-point candle extremes (the low for bullish setups, the high for bearish), giving you a signal-specific risk level right at the edge of the compression zone.
R/R ratio. The reward-to-risk ratio based on the next unreached target relative to the stop. This updates as each target is reached, so the R/R always reflects the current opportunity.
Status badge. Shows where the signal is in its lifecycle: Coil Active, Released, Goal 1 Reached, Goal 2 Reached, or Extended Target.
Step 4: Filtering Coil Signals
Use the filters at the top of the Coil Signals page to narrow down setups:
- Direction: Filter for UP (bullish) or DOWN (bearish) setups based on your market bias
- Compression type: Focus on HIGH compression for the tightest coils with the most energy
- Status: Look at activated signals for confirmed breakouts, or pre-release signals for setups still building
- Search: Type a ticker symbol to check if a specific stock has an active coil
Step 5: Saving Coil Candidates to a Watchlist
Not ready to trade a signal immediately? Add it to a watchlist for monitoring. In the chart header, click the Watchlist button (star icon). Select an existing watchlist or create a new one.
This lets you build a curated list of Coil candidates that are still compressing or approaching key levels. Check your watchlists from the sidebar to review saved signals at any time.
Pro Feature
Watchlists are available to Pro and Premium subscribers. Upgrade from the Settings page to unlock this feature.
Step 6: Confirming the Setup on the Chart
The signal card gives you the data, but always confirm visually before acting. Use the built-in chart view to see:
- Compression dots plotted on the candlestick chart (colored by compression intensity)
- The release marker showing exactly where the coil unwound
- All eight Fibonacci levels as horizontal price lines
- ABC projection markers showing the structural points
The Fibonacci legend in the bottom-left corner shows which targets have been reached (highlighted) and which is the next target (pulsing). This gives you an at-a-glance view of where the trade stands.
For a broader view, use Multi-Chart View from the sidebar to compare multiple Coil setups side by side. This is especially useful when you have several candidates and want to pick the cleanest setup.
Putting It All Together
Here is the workflow:
- Open Coil Signals to see all active setups
- Filter by direction, compression type, or status based on your strategy
- Click a signal to open the chart view with targets, stops, and R/R
- Add promising setups to a Watchlist for monitoring
- Confirm the setup visually on the chart before entering
- Track progress as Fibonacci targets are reached
The Coil detection runs continuously, so new signals appear as they form. Check back daily to catch fresh setups.
Try It Now
Head to Coil Signals in SignalFinder Pro and filter for setups firing today. If this is your first time, start with HIGH compression coils, as they represent the tightest springs with the most potential energy behind them.