Markets move in cycles of expansion and contraction. The TTM Squeeze is simply a visual way to see the "contraction" phase—when price is coiling like a spring, getting ready to release massive energy.
Most traders chase the move after the explosion. SignalFinder Pro users spot it during the calm.
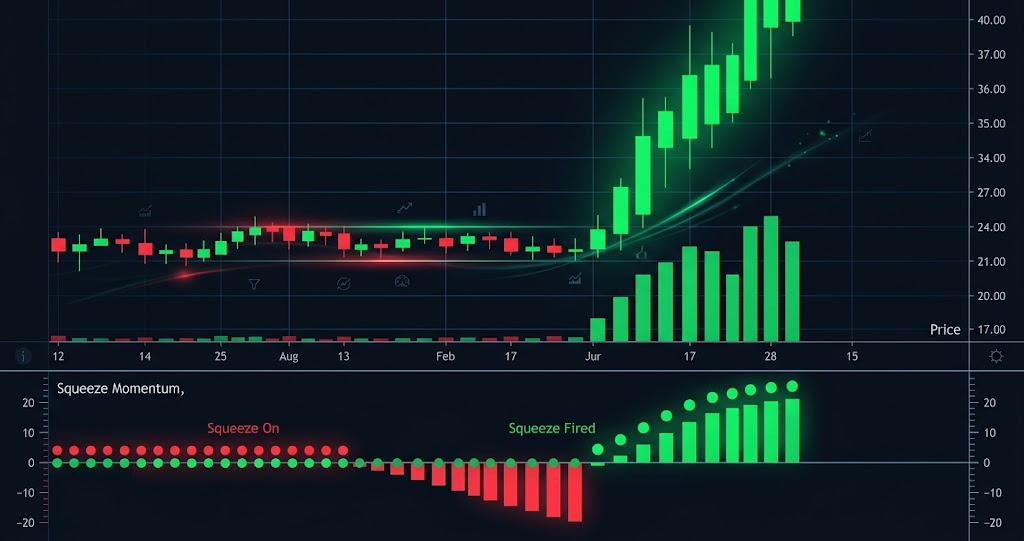
The Anatomy of a Squeeze
A "Squeeze" is mathematically defined when the Bollinger Bands (Standard Deviation) trade inside the Keltner Channels (Average True Range).
Visually, on the SignalFinder Pro charts:
- Red Dots = Squeeze is ON (Energy building).
- Green Dots = Squeeze has FIRED (The move has started).
The Strategy: "Buildup to Breakout"
We don't just buy every squeeze. We look for a 3-step setup.
1. The Trend is Your Friend (Stacked EMAs)
We only take Long signals if the EMAs are stacked bullishly:
- Price > EMA 8
- EMA 8 > EMA 21
- EMA 21 > EMA 34
If the chart is a mess of tangled lines, skip it. We want a clear trend.
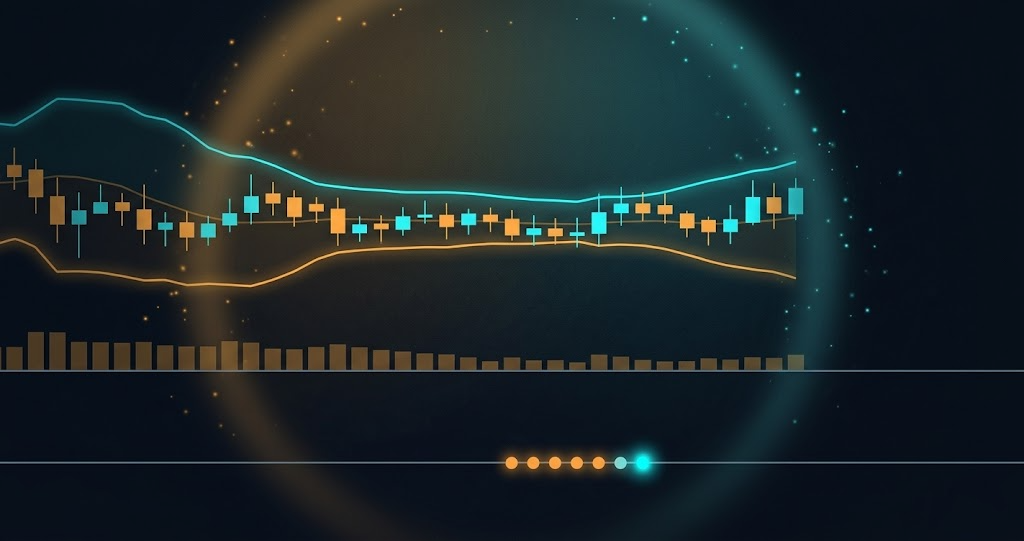
2. The Histogram (Directional Bias)
While the Squeeze dots are Red, look at the momentum histogram.
- Is it cyan/blue and rising? That suggests bullish pressure.
- Is it red/yellow and falling? That suggests bearish pressure.
We want to enter when the histogram shifts from yellow to blue while the dots are still red. This is the "early entry".
3. The Trigger (First Green Dot)
Once the Bollinger Bands expand outside the Keltner Channels, the first Green Dot appears. This is the official "Firing" of the squeeze.
- Aggressive Entry: During the red dots (anticipation).
- Conservative Entry: On the first green dot (confirmation).
Stop Loss & Targets
- Stop: Below the swing low of the consolidation (squeeze) area.
- Target: 8-10 bars of momentum expansion, or until the histogram loses color (Cyan -> Blue).
How to Find Them in SignalFinder Pro
You can't check 500 charts a day.
- Go to Squeeze Signals.
- Filter by "Squeeze Status: Squeeze ON".
- Sort by "Consolidation Days" descending. The longer the squeeze, the bigger the move.