
Chapter 1
What a gap is and why we study it
What a bullish gap is, how the SignalFinder Pro radar detects it, and what we measured across thousands of entries. The free book's first chapter.
Some mornings a stock does not open where it closed. It opens far above, leaves a hole in the chart between yesterday's high and today's low, and volume jumps. Almost always something changed overnight: an earnings report, a piece of news, a shift in what the market expects from that company. That hole is a gap.
This book is about a single kind of gap, the bullish one, and about what happened after thousands of them. It is not a collection of opinions: every number you will read came from measuring the same method over years of data.
What counts as a gap
Not every jump counts. For the SignalFinder Pro radar, a bullish gap is a day whose low stays above the previous day's high, with a hole of at least 2.5% or $3.5, and with volume of 1.75 times or more its 50-session average.
Volume matters because it separates a jump with broad participation from one that happens with almost nobody around. A hole on thin volume looks like a gap on the chart, but it is not the same thing.
The levels of each gap
Every gap comes with five references, and none of them takes a formula to read:
- The floor is the low of the gap day. While the gap waits, if price makes a lower low, the floor moves down with it.
- The entry level sits a little above the floor. The gap enters on the day price closes above that level.
- The first target and the extended target sit higher, and they are calculated from the size of the gap's move.
- The invalidation level is the low of the day before the gap. A close below it cancels the gap.
If more than 20 sessions pass without the gap entering, it expires. Once it enters, the floor stays fixed.
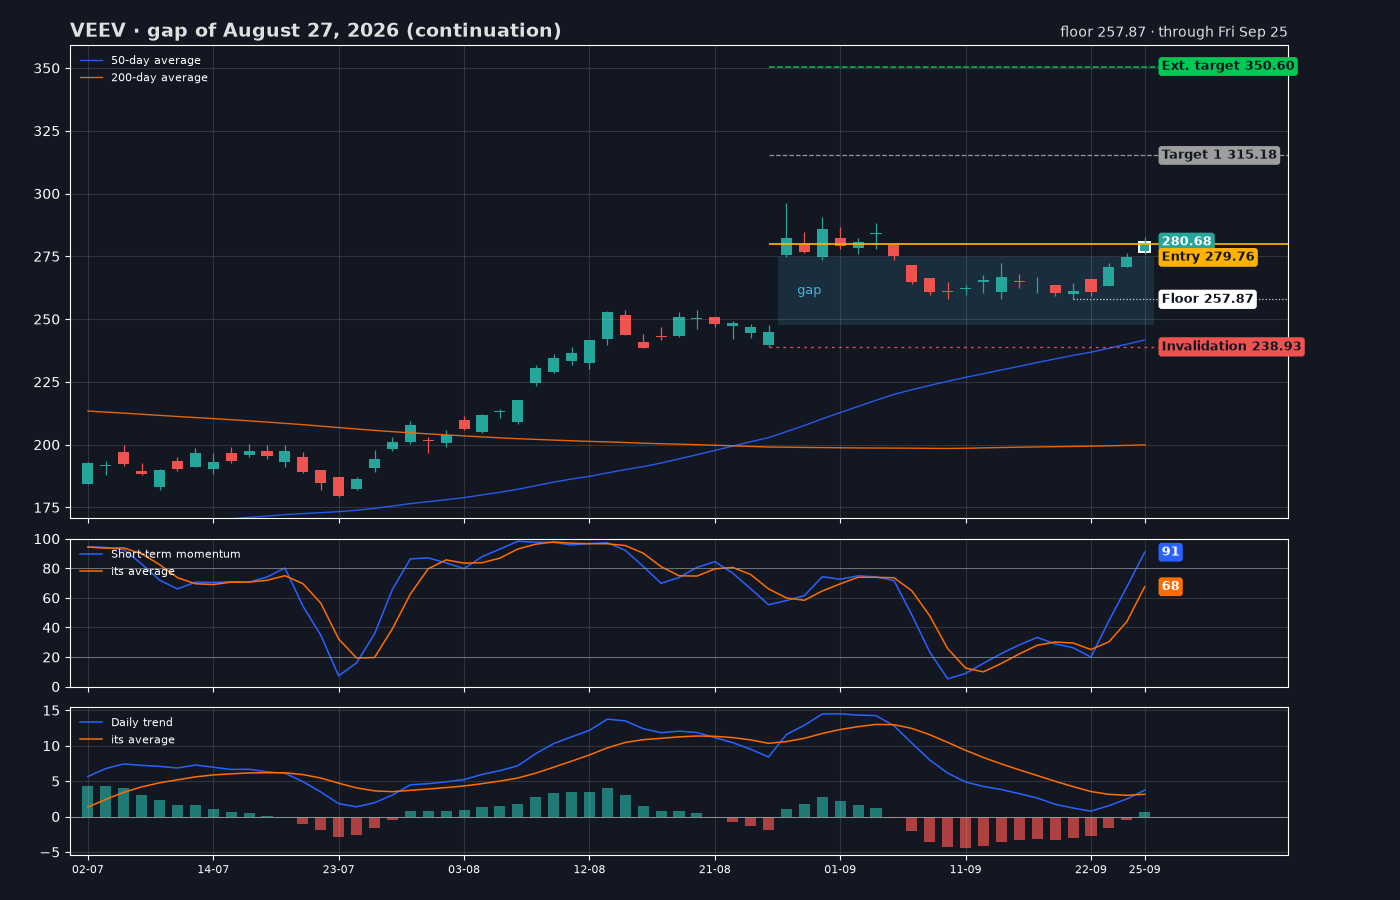
The case in the chart is VEEV. On August 27, 2026 it opened with a hole of 10.9% and 3.1 times its average volume. Instead of rising further, price drifted lower, and each new low moved the floor down: 6 times. On September 25, 2026 it finally closed above its entry level, in session 20 after the gap.
What we measured
We measured the same method over thousands of gaps, and the first answer is good: the great majority of entries move up. Nine in ten touched their first level above the entry, and three in four reached their first target.
- 90.4%touched its first level above the entry
- 86.8%closed session 21 above its invalidation level
- 89.5%reached the extended target when the floor held
The extended target is the most ambitious of the three, and that is where the floor makes the difference. When price did not fall back below the floor after entering, 89.5% of the entries went all the way to the extended target.
For options users there is another way to see it: thirty days later, almost nine in ten entries were still above their invalidation level, and the figure barely changed between the two periods we measured: 86.4% and 87.1%.
That is the thread of the whole book: what can be seen in time to stay with the entries that hold. The next chapters tell it piece by piece: volume, the Fibonacci levels, momentum and trend, the check before the close, and the second entry.
How to read this book
Every number in this book is a measurement of the past, made by SignalFinder Pro with the radar's own engine. It helps you understand how the method has behaved, not promise what it will do: the past does not guarantee future results, and trading stocks and options carries a risk of loss. It is educational material, not a recommendation.
You will not find a ranking of "the best gaps" either. We tried ranking them with technical scores, with the criteria written before seeing the results, and none improved enough on the method as it is. That is why we give you every gap that meets the method, with its levels, and the decision is yours.
Keep reading for free
Leave your email to unlock every chapter and the PDF. We also send you the PDF link.